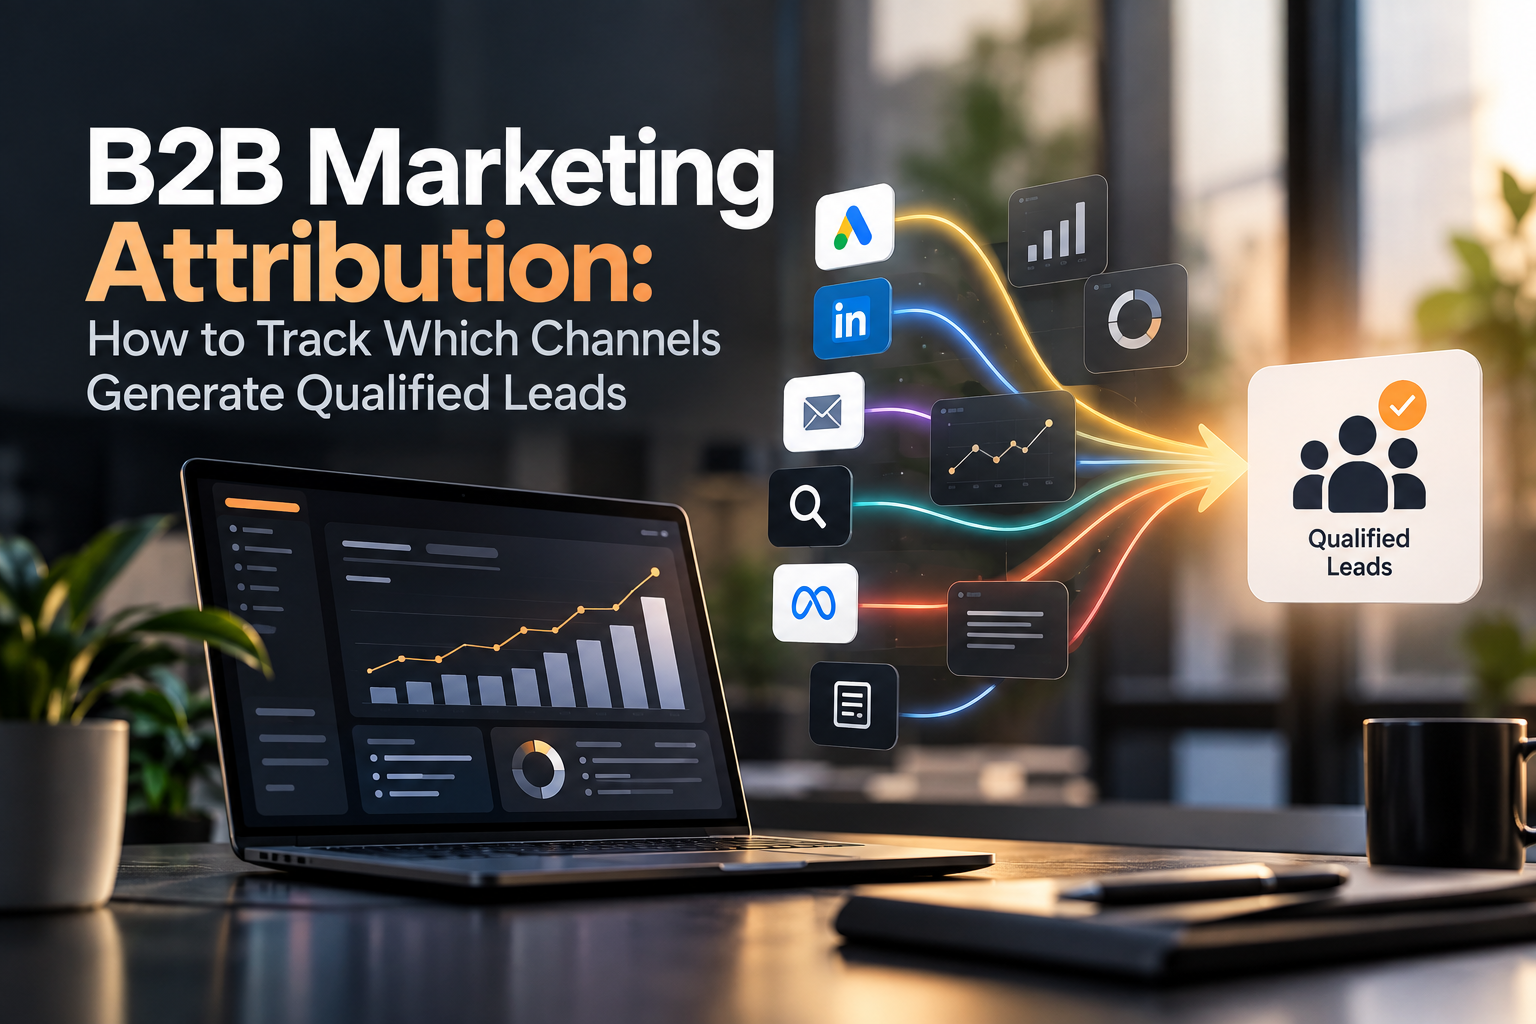

Quick answer: B2B marketing attribution is the process of assigning credit to each channel and touchpoint that moved a buying group toward a sale. To see which channels generate qualified leads, attribute at the opportunity stage in your CRM, roll contacts up to accounts, use a W-shaped model held for two quarters, and judge channels on cost per qualified opportunity.
tl;dr: To track which channels generate qualified leads, stop attributing at the form-fill stage and start attributing at the opportunity stage inside your CRM.
Roll every contact up to its account, apply a W-shaped model that credits first touch, lead creation and opportunity creation, then hold that model steady for two quarters.
When you do this, branded paid search almost always loses credit and LinkedIn, organic content and referrals gain it.
Measure every channel on cost per qualified opportunity, not cost per lead.
What B2B Marketing Attribution Actually Measures
B2B marketing attribution is the process of assigning credit to each channel and touchpoint that moved a buying group toward a sale.
In B2B it must track accounts and opportunities, not just individual contacts, because purchases involve several people over months.
A model that only credits the final click will systematically undervalue the channels that create demand.
That last point trips up almost every team I’ve audited.
A CFO who reads three of your articles in March, ignores your ads in June and finally converts from a branded search in September did not “come from Google.”
Google got the credit because the model was built for e-commerce.
a short explainer on multi-touch attribution for B2B
https://www.youtube.com/watch?v=45Mon85_C2U ]
Google’s own documentation on data-driven attribution in GA4 is worth reading once, because it explains how credit is distributed by comparing converting and non-converting paths.
It also shows the limit: GA4 sees sessions, not accounts.
That gap is where most B2B teams lose the plot.
Which Attribution Model Fits a Long Sales Cycle
Multi-touch attribution B2B teams rely on comes in a handful of flavours.
Each answers a slightly different question.
Picking one is less about being “right” and more about being consistent for long enough that the trend lines mean something.
Last touch
- How credit is split: 100% to final interaction
- Best for: Quick sanity checks
- Blind spot: Ignores everything that built intent
First touch
- How credit is split: 100% to first interaction
- Best for: Measuring demand creation
- Blind spot: Ignores nurture and sales assist
Linear
- How credit is split: Equal share to every touch
- Best for: Simple, defensible reporting
- Blind spot: Treats a newsletter open like a demo
Position-based (W-shaped)
- How credit is split: Heavy on first touch, lead creation and opportunity creation
- Best for: Most B2B pipelines
- Blind spot: Needs clean CRM stage data
Data-driven
- How credit is split: Algorithm assigns credit from your history
- Best for: High-volume programmes
- Blind spot: Needs hundreds of conversions to be stable
In our own reporting we default to W-shaped for anything with a sales cycle over 60 days.
It rewards the channel that found the account, the one that converted the contact and the one that helped sales open the opportunity.
Those three moments are the ones a revenue leader actually cares about.
Data-driven models are attractive but they need volume.
If your business closes 30 deals a quarter, the algorithm is guessing.
A rules-based model you understand beats a black box you don’t.
[Stat card: 3 moments a W-shaped model credits
- First touch
- Lead created
- Opportunity created]
Why “Leads” and Qualified Leads Need Separate Tracking
Qualified leads are the only leads worth attributing.
A form fill from a student, a competitor or a vendor pitching you is noise it drags channel performance numbers in whichever direction the noise leans.
The fix is a two-layer report.
Layer one attributes contact creation.
Layer two attributes opportunity creation, which in most CRMs is the moment sales accepts the lead as real.
HubSpot’s guide to building attribution reports shows how contact, deal and revenue reports sit on top of each other.
Run all three or you’ll optimise for the cheapest layer.
When I compare the two layers for a new client, the ranking almost always flips.
Paid social wins on contacts.
Organic search and partner referrals win on opportunities.
Nobody in the room expects it the first time.
What to check before you trust a channel’s number:
- Lead-to-opportunity rate by channel. Below 10% usually means the channel is buying volume, not intent.
- Time to first sales touch. Channels that produce leads sales ignores for a week are producing the wrong leads.
- Account overlap. If one channel’s “wins” are all accounts another channel touched first, the credit is misplaced.
- Self-reported source. A “how did you hear about us” field catches podcasts, word of mouth and events that pixels never see.
Performance marketing services that report only on cost per lead are, in effect, reporting on the layer that matters least.
Cost per qualified opportunity is the number to hold them to.
A strong marketing automation strategy can help teams maintain consistent tracking across the different stages of the buyer journey.
A Real Example: 14 Months of Misread Data
A mid-market SaaS company came to Neoma Media convinced that paid search was its best channel.
Last-click data in GA4 showed search generating 52% of demo requests at the lowest cost per lead in the mix.
We rebuilt the reporting at the account level and applied a W-shaped model against CRM opportunity data.
The picture changed quickly.
Before (last click, contact level)
- Paid search: 52% of demos
- LinkedIn: 11% of demos
- Organic content: 9% of demos
After (W-shaped, opportunity level)
- Paid search: 31% of opportunities, mostly branded terms
- LinkedIn: 27% of opportunities as first touch
- Organic content: 24% of opportunities, mostly comparison pages
Branded search was catching demand that LinkedIn and content had created.
Non-brand search, the part of the budget that was actually growing, produced opportunities that closed at less than half the average rate.
The client cut non-brand search spend by roughly a third, moved that budget into LinkedIn and comparison content and saw qualified pipeline rise 38% over the following two quarters.
Cost per lead went up.
Nobody minded, because cost per closed deal went down.
Our head of analytics summed it up in the review meeting: “The old report wasn’t lying. It was answering a question nobody had asked.”
That is the value a b2b performance marketing agency should be delivering.
Not a nicer dashboard.
A different decision.
How to Set Up Attribution That Sales Will Trust
Attribution only works when sales believes the numbers.
That means the data has to start in the CRM, not the ad platform.
Standardise UTM parameters
One naming convention, enforced by a shared sheet or a builder tool.
Inconsistent tags are the single biggest source of “direct” traffic.
Capture first-touch and last-touch fields on every contact
Most CRMs do this natively.
Make sure they can’t be overwritten by a later form.
Add a self-reported source field to every high-intent form
Keep it a free-text box.
Dropdowns hide the channels you didn’t think to list.
Report at the account level
Roll contacts up to their company before you assign credit.
This is the step most teams skip and the one that changes the answer.
Pick one model and hold it for two quarters
Switching models every month destroys the trend lines you need.
Review with sales monthly
Ten minutes comparing the attribution report against the deals they remember will surface tagging errors faster than any audit.
Google has been retiring rules-based models inside Google Ads in favour of data-driven attribution.
That is fine for bidding.
It is not a reason to let an ad platform become your source of truth for pipeline.
A paid-dependent consulting firm can easily end up judging performance through the same channel it relies on for acquisition, which is why CRM-based attribution matters.
[Timeline visual:
Ad click → Contact created → Lead accepted → Opportunity opened → Closed won]
A PPC marketing agency worth keeping will hand you conversion data that flows into your CRM and let your attribution model judge it alongside every other channel.
If the agency only reports from inside the ad account, it is grading its own homework.
Conclusion
Attribution is never finished.
Channels change, buying groups get bigger and tracking gets harder every year.
The teams that win are the ones that keep the model simple enough to explain in a sentence and check it against real deals every month.
Neoma Media builds reporting on that principle it holds up.
Frequently Asked Questions
What is B2B marketing attribution?
B2B marketing attribution is basically the process by which credit is given to those marketing efforts that lead to a company’s purchase.
It is different from consumer marketing attribution in that it needs to factor in a number of parties, long sales cycles and offline interactions.
How is multi-touch attribution B2B different from single-touch?
Single-touch models give all credit to one interaction, usually the first or last.
Multi-touch attribution B2B models spread credit across several interactions along the path to purchase.
This matters in B2B because a deal may involve ten or more touches across three months before anyone speaks to sales.
What counts as qualified leads in attribution reporting?
Qualified leads are contacts that meet an agreed definition of fit and intent, usually confirmed by sales accepting them.
Attributing at the qualified stage rather than the raw lead stage removes noise from students, vendors and competitors.
It also reveals which channels produce buyers rather than form fills.
What kind of attribution model should the B2B business begin with?
The position-based or W-shaped attribution model tends to work great for most B2B businesses.
The one which gives credit to the touch which identifies the account, the touch which generates the lead and finally the touch which opens the opportunity.
Data driven attribution models would suit best for campaigns with thousands of conversions each month.
Can GA4 be used for B2B attribution all by itself?
GA4 can help in session level attribution but cannot handle B2B attribution as it does not understand accounts, opportunities and revenue.
Teams that rely on GA4 alone tend to over-credit branded search and under-credit content.
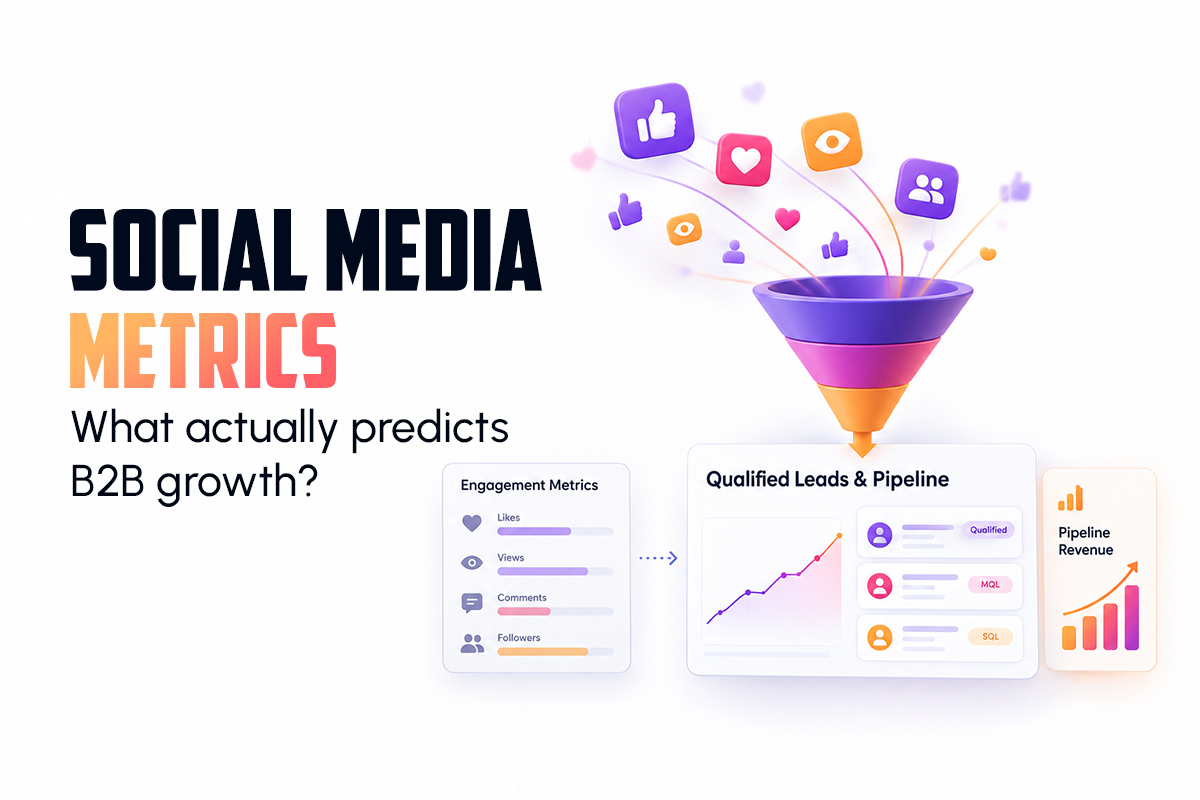
For B2B teams, the goal is not simply turning engagement into leads, but understanding which interactions contribute to qualified opportunities and revenue.