


tl;dr:
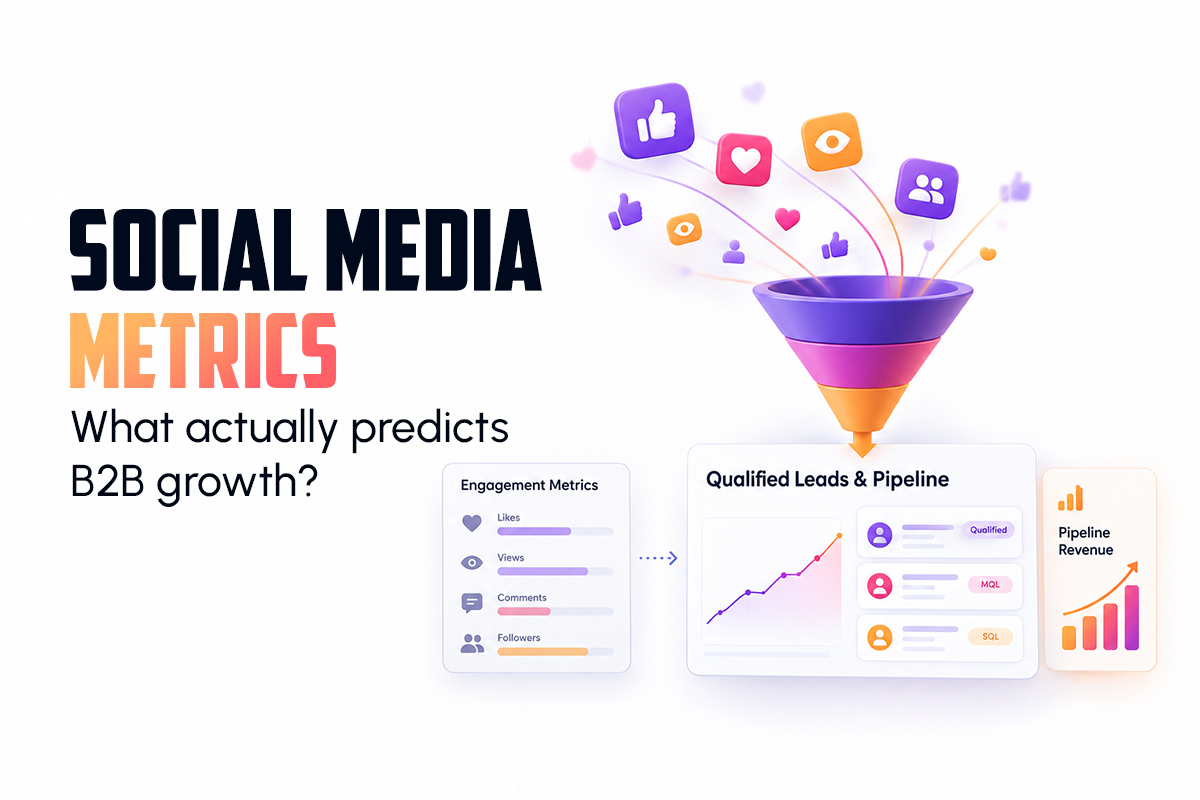
- Followers, impressions and likes tell you content was seen. They don’t tell you anyone is closer to buying
- The numbers that predict B2B growth sit further down: visits to buying pages, sales conversations, social-sourced pipeline and win rate
- Most of them live in your analytics and CRM, not inside LinkedIn
- Measure fewer things and tie each one to revenue
Intro:
Most social media metrics in B2B reports answer the wrong question. They tell you how many people saw a post. Leadership wants to know whether social media is helping the company win deals.
Picture two posts. One reaches 50,000 people and moves nobody closer to a purchase. The other reaches 900 people and starts three sales conversations.
This guide separates the two. You will see which numbers to stop reporting, which ones to watch instead, a real company that made the switch and a simple way to work out ROI.
About this guide: last reviewed in October 2026. Figures come from the Ehrenberg-Bass Institute, Gartner, the Content Marketing Institute and a published Clari case study. The ROI example uses illustrative numbers and is labelled as such.
Why Most B2B Social Reports Measure the Wrong Thing
B2B buying does not work like a consumer purchase. No one sees a LinkedIn post on Monday and signs a contract on Tuesday.
Three things make social hard to measure:
- Most buyers aren’t buying yet. Professor John Dawes of the Ehrenberg-Bass Institute estimates that only about 5 percent of B2B buyers are in the market at any given time. That is the idea behind the 95:5 rule. The other 95 percent will buy later and your content has to be remembered until then
- Decisions are made by groups. Gartner’s research on B2B buying puts a typical buying group for a complex purchase at six to ten decision makers. The person who likes your post is often not the one who signs
- A lot of influence is invisible. Posts get screenshotted into WhatsApp groups and forwarded in Slack. Analytics records that visit as direct
So platform dashboards will always undercount what social does. Most of the influence happens long before anyone fills in a form. That’s not a reason to give up on measurement. It’s a reason to measure different things.
Chris Walker, who founded Refine Labs, covers this well in his dark social keynote. He explains why so much B2B buying happens in places attribution tools can’t see.
Vanity Metrics That Don’t Predict B2B Growth
Here is a quick vanity metrics overview. These numbers aren’t useless but they cannot carry a business case on their own.
- Follower count grows with giveaways, trending posts and people outside your market
- Impressions count screens a post appeared on, not people who read it
- Likes and reactions often come from peers, competitors and your own employees
- Engagement rate rewards opinions and humour over useful buying content
- Video views on most platforms count a few seconds of autoplay as a view
The real issue lies in how teams use them. If a report begins with reach and the team understands that they need to reach for reach while content loses touch with what will help the buyer make up their mind.
This can be seen in industry statistics as well. In the 2025 B2B Benchmarks, Budgets and Trends research paper produced by the Content Marketing Institute, where 980 B2B marketers were surveyed between June and August 2024, 87% of respondents said that content creates brand awareness but only 49% said it creates revenue or sales. Awareness is one thing. Creating revenue is another.
When Reach Still Matters
Vanity metrics are not always vanity. The same 95:5 research is a reminder that most future buyers aren’t ready yet, so being seen by them now does count later. The answer isn’t to ignore reach. It’s to filter it.
- Count reach among your target job titles and industries instead of total reach
- Treat reach as a leading indicator and check it against branded search and inbound demand a few months later
- Report employer-brand and hiring posts separately because their goals are different
The Social Media Metrics That Do Predict Growth
The useful metrics share one trait. Each one shows a buyer moving closer to a decision.
| Instead of tracking | Track this | Why it matters |
| Followers | Followers who match your target job titles and industries | Reach only matters if it’s the right people |
| Impressions | Social visits to pricing, case study and demo pages | These pages signal buying intent. |
| Likes | Comments and DMs from people at target accounts | A conversation is worth more than a reaction |
| Engagement rate | Leads who mention social in how did you hear about us | Buyers tell you what influenced them |
| Clicks | Social-sourced pipeline and win rate | This is the number leadership acts on |
Two more signals deserve a place in your monthly report:
- Sales cycle length for deals that engaged with your content compared with deals that didn’t
- Branded search volume, because people who remember you start searching for you
None of these will look as impressive as a reach figure. They will tell you far more about whether social belongs in your B2B growth strategy.
Content plays a direct role here. A strong B2B content strategy builds posts around the questions buyers ask on sales calls, so the people who engage are the people who buy.
Case Study: How Clari Traded Lead Volume for Pipeline Quality
Clari is a revenue platform used by B2B sales teams. Its marketing team ran a fairly traditional paid programme. Ads drove people to download content, forms captured leads and the numbers looked busy. The team wasn’t sure the activity was producing customers.
Working with the agency Refine Labs, Clari changed what it optimized for:
- It stopped using LinkedIn lead-gen forms and content-download campaigns
- It targeted specific accounts and buyer roles instead of broad audiences
- It ran zero-click content that taught buyers something inside the feed without asking for a form fill
- It cut broad paid search keywords and kept only high-intent terms
The reported results, according to the Clari case study:
Cost per sales-qualified opportunity also dropped by more than a third.
Just a few disclaimers before we move on and use the e1xample lesson. These numbers are sourced from the company’s case study and do not mention any time frame or method used to calculate the numbers. This is because Clari did have a new category positioning strategy for revenue leaks around the same time, so not all of the success could have been due to channel strategy alone. Clari produced fewer form fills on purpose and the business results improved. If leads had been the main metric, the change would have looked like a failure in month one.
How to Measure Social Media ROI in B2B
Social media ROI is the profit social generates compared with what you spend on it. The formula:
ROI (%) = (gross profit from social-sourced revenue − total social cost) ÷ total social cost × 100
Gross profit is used instead of revenue because revenue overstates the return whenever delivery costs are high. Finance teams will ask about this, so it’s worth getting right from the start.
Two rules keep the number honest:
- Use closed revenue, not pipeline. Pipeline is a forecast. Use it as an early signal but keep it out of the ROI figure
- Separated from influenced. A sourced deal began with social, such as a post or DM that brought the lead in. An influenced deal started elsewhere but the buyer engaged with your content along the way. Report both but count only sourced revenue in ROI so the same deal isn’t claimed by several channels
A Worked Example
The numbers below are illustrative:
- Social costs ₹9 lakh over six months, covering team time, tools, agency fees and ads
- Social-sourced deals closed in that period are worth ₹40 lakh
- With a 40% gross margin, the above revenue translates to ₹16 lakh in gross profit
- ROI = (16 − 9) ÷ 9 × 100, which approximates to 78%
In case the deals have not been closed yet, then social-sourced pipeline can be multiplied by the historical win rate. Tag it as an approximation.
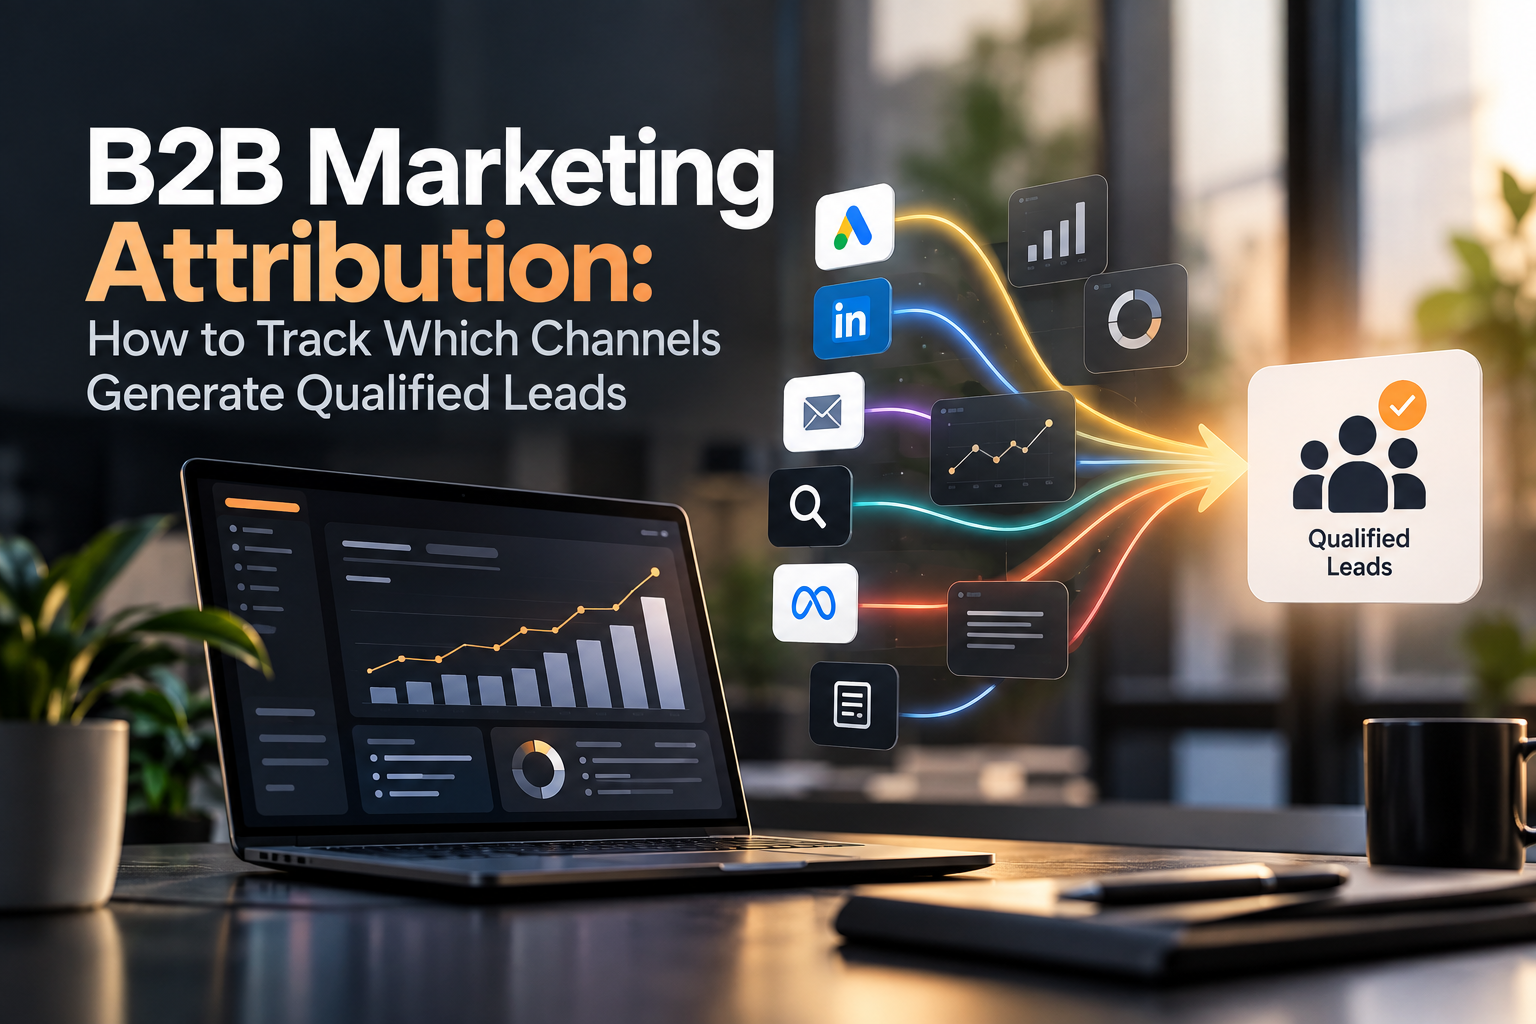
For attribution purposes, it is important to keep things straightforward. Simply combine first-touch information from your CRM along with the answers from the free text how did you hear about us field. The latter picks up what tracking software misses.
A Simple Measurement Framework by Funnel Stage
This is the framework the Neoma Media team uses in monthly client reviews. Track one or two numbers per stage. Anything more becomes noise.
| Funnel stage | What to track | Healthy sign |
| Awareness | Reach among target job titles | The right people see you, not just more people |
| Interest | Social visits to case studies and pricing | High-intent visits rise month on month |
| Consideration | Demo requests and DMs from target accounts | Prospects mention your content on first calls |
| Pipeline | Social-sourced and influenced opportunities | Pipeline value grows quarter on quarter |
| Revenue | Closed deals with a social touch | Those deals close faster or at a higher value. |
Review this monthly with sales in the room. It works best as part of a wider marketing performance strategy, where social is judged by the same commercial yardstick as email, events and paid search.
Mistakes That Make Social Look Worse or Better Than It Is
- Reporting every metric the platform offers instead of the few that matter
- Judging a post after 24 hours when B2B buying takes months
- Skipping UTM tags, then wondering why so much traffic shows as direct
- Counting pipeline as revenue in the ROI figure
- Changing what you measure every quarter, so trends cannot be compared
- Never asking sales which posts prospects mention on calls
The last one is the cheapest fix. A 15-minute monthly chat with sales will tell you more than most dashboards and it should shape your social media strategy for the next quarter.
Frequently Asked Questions
Which Social Media Platform is Best for My Type of Business?
For most B2B businesses, LinkedIn will be the appropriate choice since decision-makers use the platform for business. YouTube is perfect for products that require some explanation. You should focus on doing one platform well rather than doing poorly at several.
How Long Will It Take to See Results of Social Media Marketing?
On average, initial signs like visits to profiles, comments from target accounts, and inbound messages should start showing after two or three months of consistent posting. Pipeline will take longer and will depend on deal sizes. It will usually take B2B deals with longer buying cycles six months or even longer.
How do I Measure ROI from Social Media Marketing?
Subtract total social cost from gross profit earned on social-generated revenue. Then divide the difference with the social cost and multiply by 100. Base your calculations on closed deals from your CRM and check the result quarterly.
What Is the Difference Between Organic Social Media and Paid Social Media Advertising?
Organic is content published by you on your pages for free. Paid is where you pay a platform to display your content to a selected audience. Organic
How much does social media marketing cost for a business in India?
What to Do This Month
Start with three changes. Add a free-text source field to your forms. Tag every link you share. Replace reach in your monthly report with social visits to buying pages and social-sourced pipeline.
Give it two quarters. You’ll know what social actually does for your business.
If you want help setting up social reporting that ties to revenue, take a look at Neoma Media’s Social Media Marketing Packages or talk to our team.